This website uses cookies so that we can provide you with the best user experience possible. Cookie information is stored in your browser and performs functions such as recognising you when you return to our website and helping our team to understand which sections of the website you find most interesting and useful.
Bicycle-Schemes, Data and a World of Possibility
Estimated reading time: 7 minutes, 45 seconds
The irony of the situation in the UK (and much of the world) suddenly being plunged into “lockdown” and us all simultaneously desperate to go out and enjoy the first day of sun and the great outdoors after being cooped up all winter was not lost on me as I cycled my almost forgotten-about bike down the canal towpath this weekend.
Our desperate reliance on devices and our need to be glued to them at all times has kept us tethered to the nearest charging point, but as soon as we’re implored to stay at home as a matter of safety we depart in droves, heading for the hills at the first wink of sunshine.
It got me thinking about cycling in general, and with an 8-mile trip ahead of me I had time to consider the potential application of our platform to a bike-share scheme.
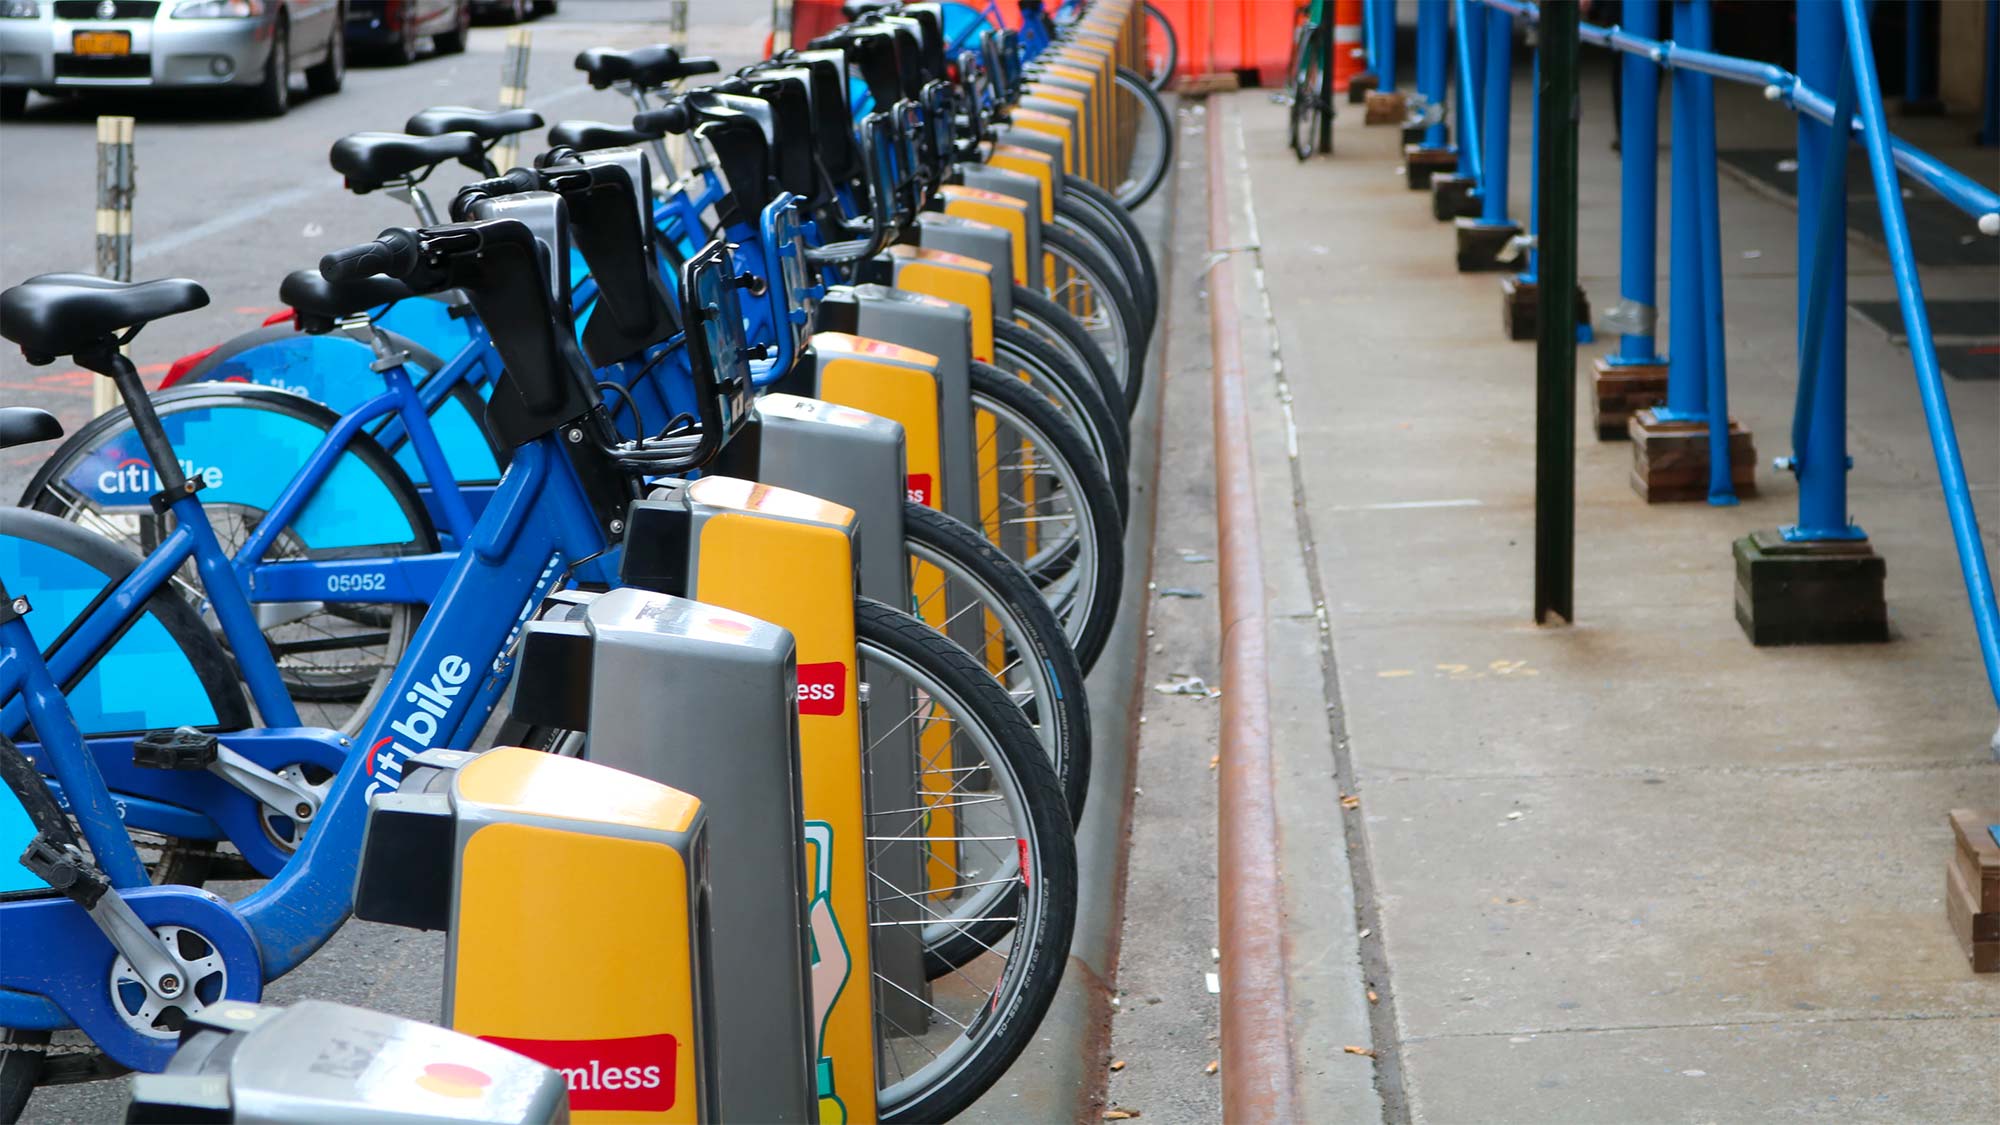
In many cities around the world, we are fortunate to have bike rental, cycle hire or some form of publicly accessible transport scheme involving docking stations and the ability to take journeys from one docking spot to another.
London called (and mostly still calls) them “Boris Bikes”, after the Mayor-turned-Prime-Minister that was serving when they were introduced, despite being now owned by Santander. Edinburgh saw the introduction of a cycle scheme just a few years ago, sponsored by food delivery firm JustEat and even with all destinations in Edinburgh being uphill (even on the way back), it seems the scheme has been relatively successful and there are plans to electrify bikes in the near future to combat the uphill situation.
Those are just two of what’s believed to be roughly 1000 cities worldwide that have a bike-sharing scheme. Not to mention the fact that many cities operate more than one scheme, with competing systems jostling to share the same spots. I can recall at least 2 or 3 schemes from my time in Copenhagen a few years back (Denmark’s capital is something of a cycling haven as it happens).
With all of these schemes, comes yet another wave of data. As with almost any new business these days, the people running things have the ability to harness the power of data to improve their business, and better serve their customers. In this example, most commonly the customers will be the cyclists. Those end-users pedalling the produce so to speak. Secondary beneficiaries of streamlined or otherwise improved operations might be sponsors and advertisers, locations served by bikes, tourism, and dare I say it, the council.
It might be hard to imagine, so let’s look at what sort of data might be available to those owning and operating a cycle-share scheme.
The data
In terms of raw data collected, you’re looking at usage statistics and user data. First of all, anybody who wants to use a bike will need to sign up to do so, meaning at the very least name, payment details and some basic personal meta-data will be recorded. Probably alongside their method of signing up, whether via the bike’s own interface, a point-of-sale (POS) unit at a terminus or docking station, a mobile app, or sat at home on their laptop with a voucher code. From that point onwards, their login credentials will tie them to and allow the collection of primarily their usage of the scheme.
So, for each user of the scheme, there will be a number of things possible to track. Assuming all systems are working as they should, things like frequency of journeys, where journeys start and end, what routes are taken and what speeds are gone will be basic information related to the bikes. Alongside that you have date signed up, length of subscription, total payments and various billing-related things. Probably address too (so in-turn, proximity to the scheme in question).
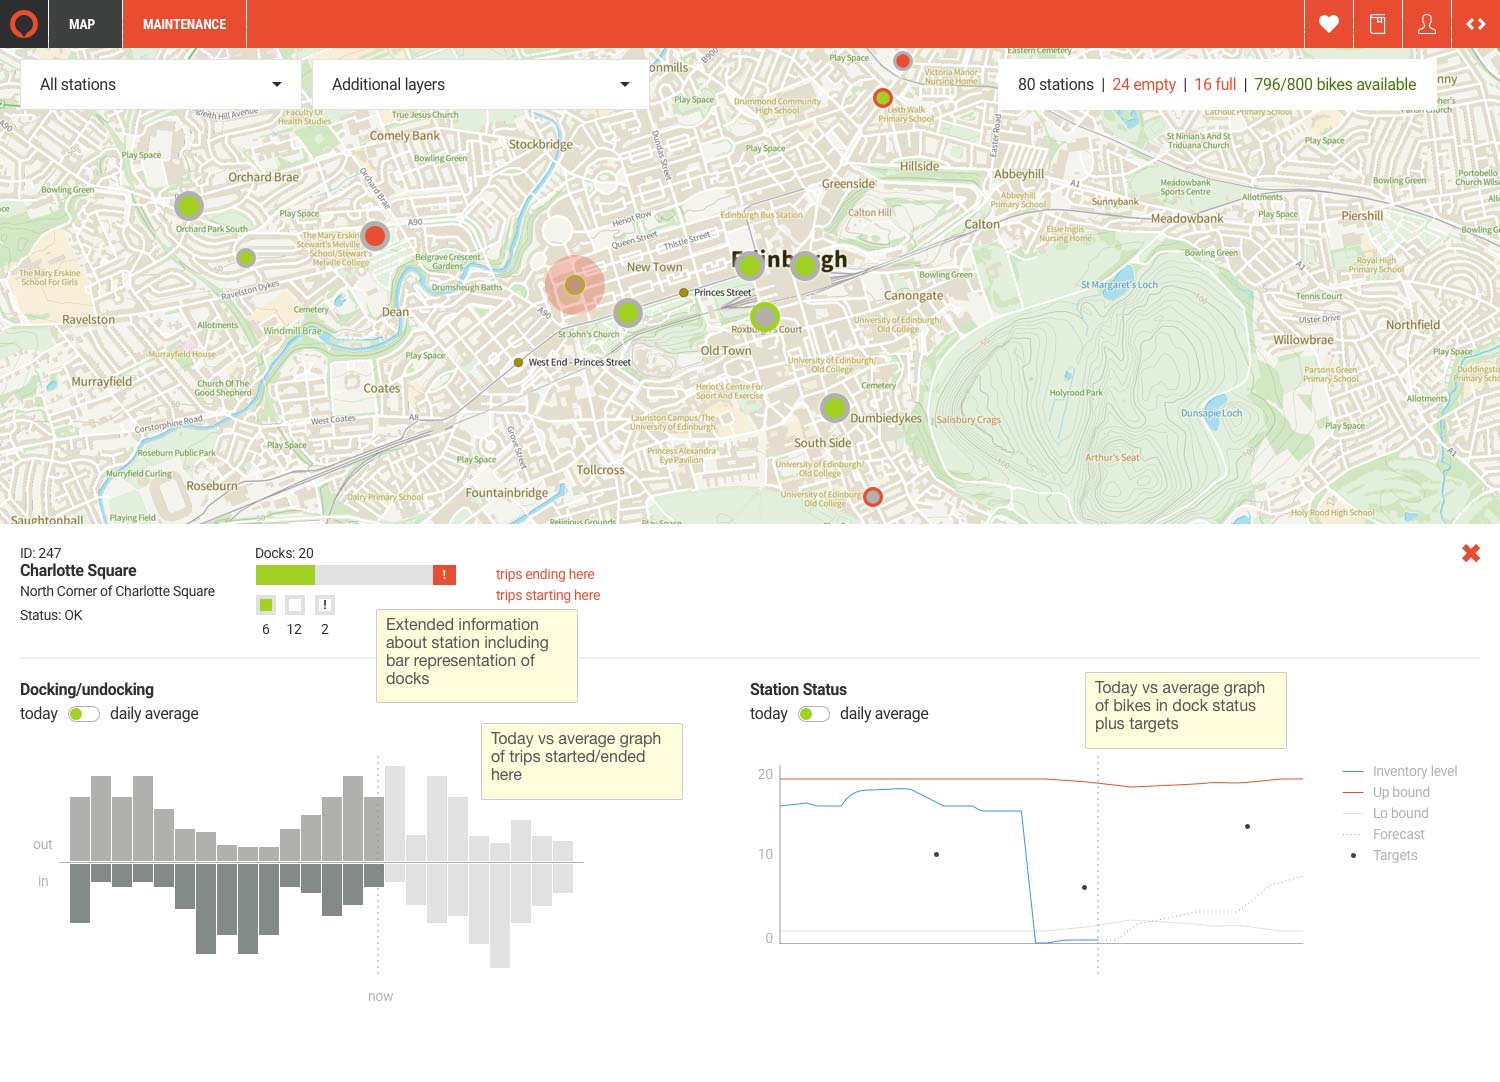
For each cycle in the scheme, it will be possible to track things like how many users have cycled that bike, where the bike has been in the area, where it’s been docked, battery levels, possible repair situations, and plenty more I imagine.
This all goes hand in hand with the docking system data which will know how many bikes are docked, their battery levels, where they’ve been and how popular a station might be.
The application of data
Pulling all of this data together into a single system (for example, our very own platform) is then where the real power lies to make improvements and gain insights.
From a planning perspective, the scheme owners can use this to determine a number of useful things.
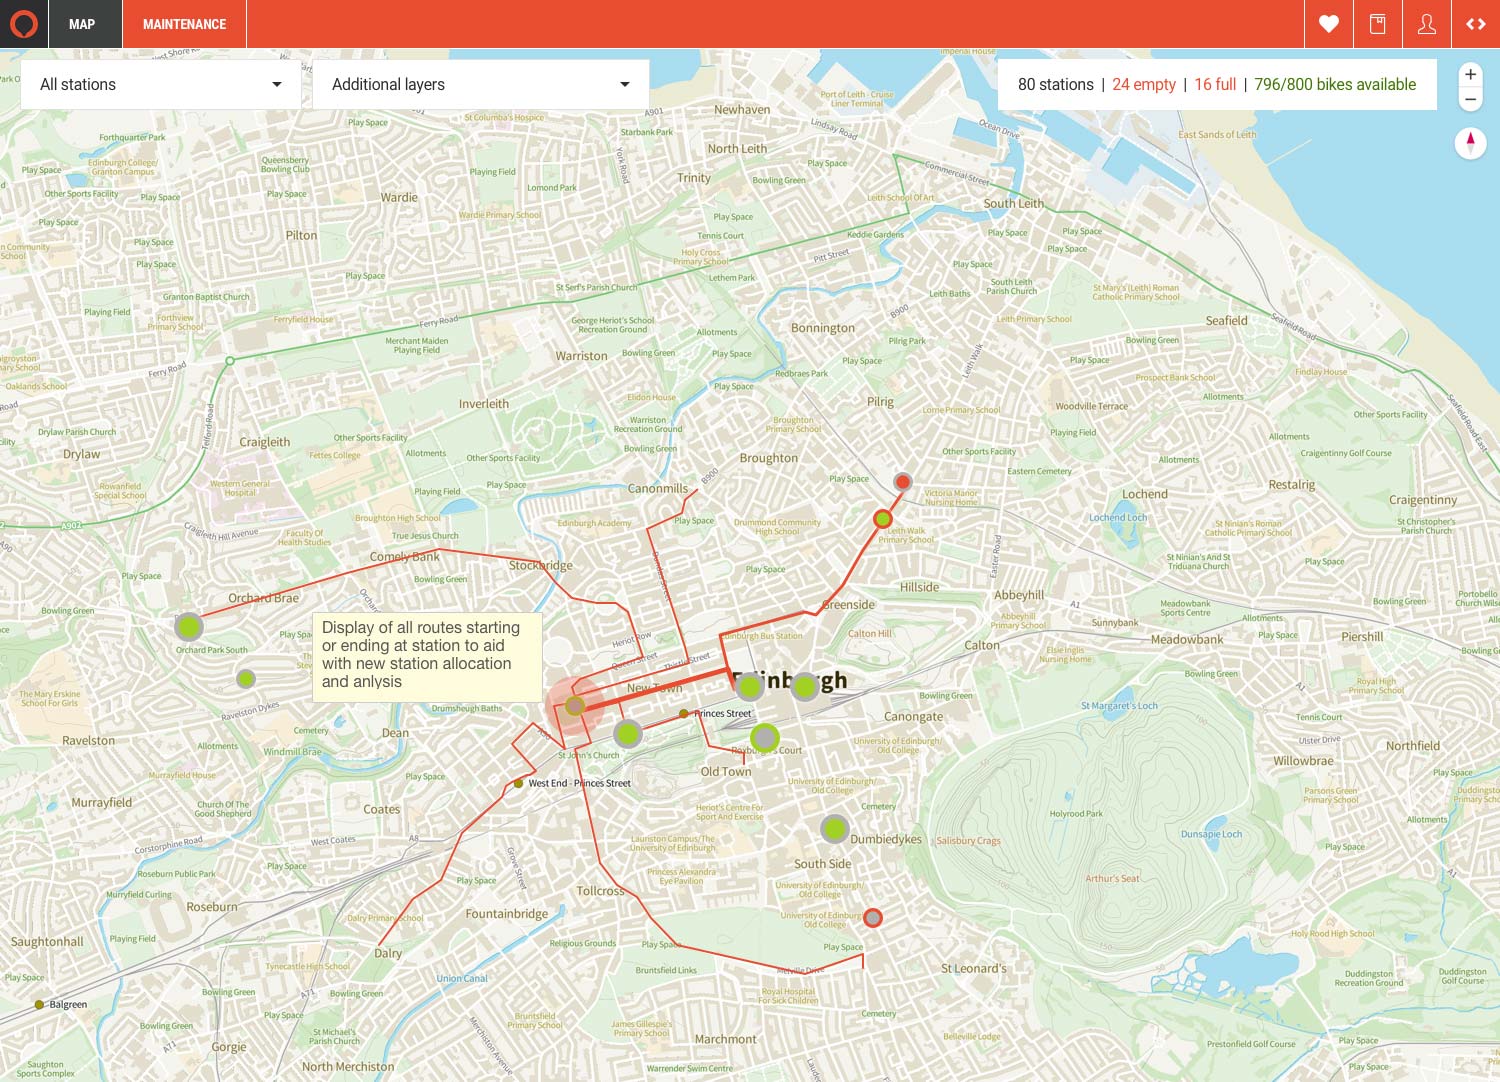
Firstly, the most commonly taken routes by cyclists means a picture of the streets in a city or town that people cycle on. Yes, this is driven partially by the availability of the bikes and current docking locations, but it could be a valuable resource for working with the relevant authorities to plan potential bike lanes or improve traffic flow to account for cyclists.
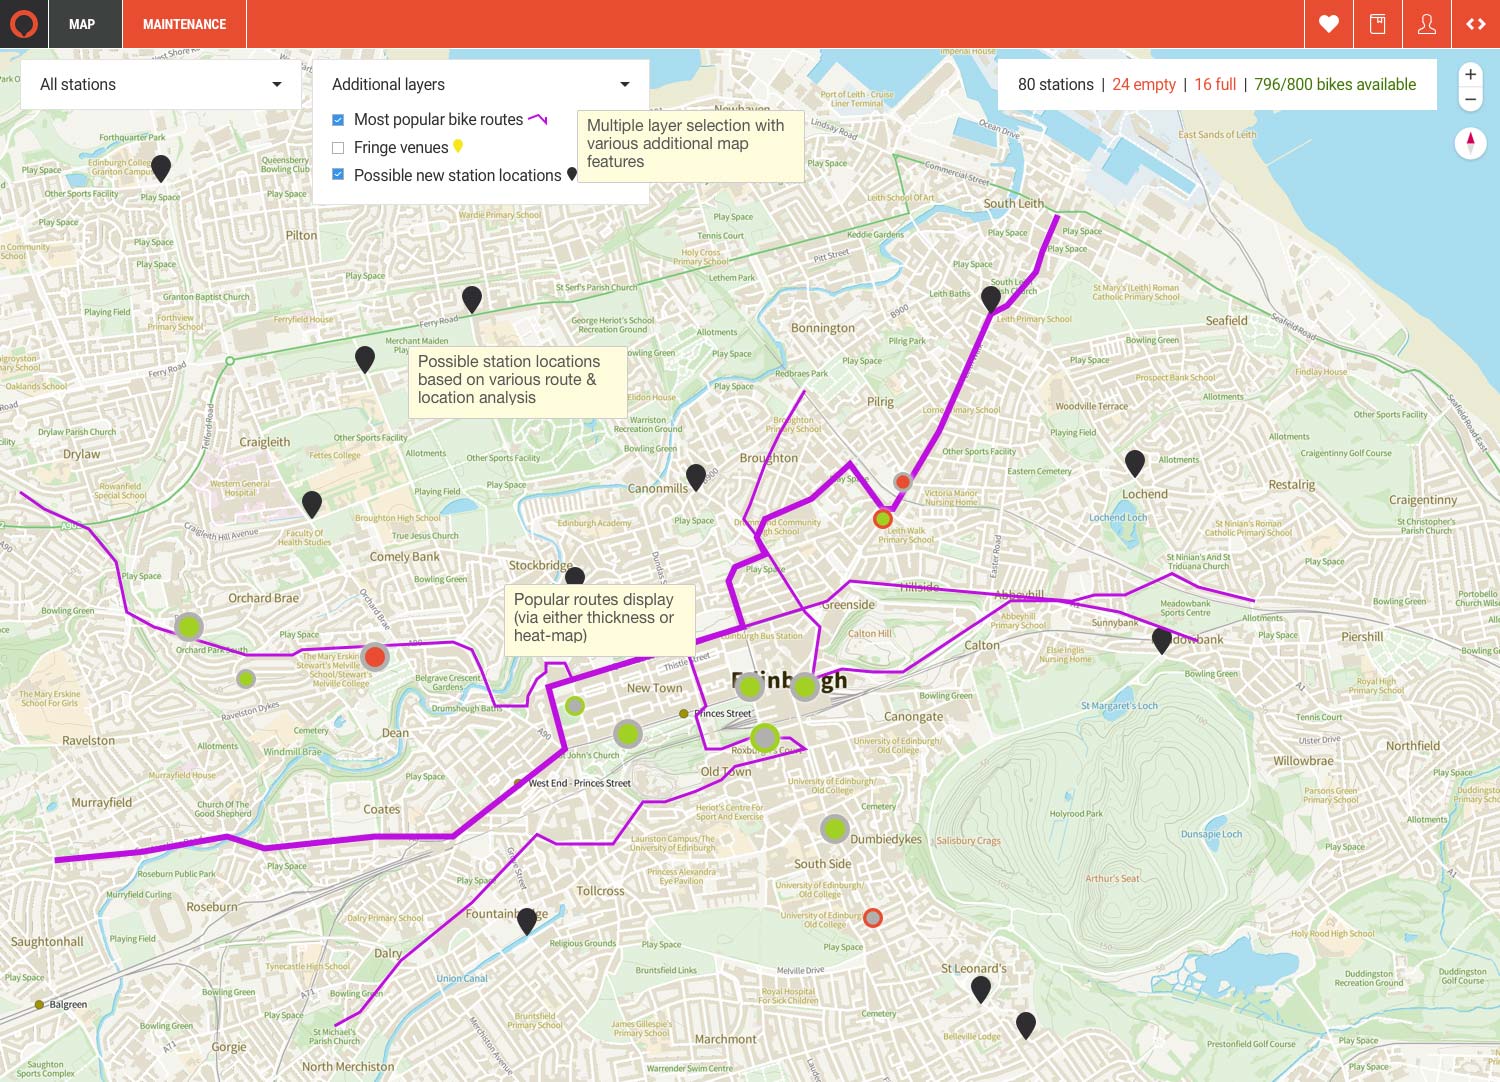
Knowing the most commonly cycled areas, crossed with the location of docking stations also means that it’s possible to plan where the next docking stations might be able to go. Combine this with local authority information or mapping information about population density, street width, pavement availability and land-use means that less guess-work has to go into expansion of these schemes.
Plotting routes and docking stations on a map can also highlight which attractions might be getting passed or visited the most, meaning the ability to promote or incentivize visits to certain places, whether that’s a cafe near a docking station or a museum via a different route.
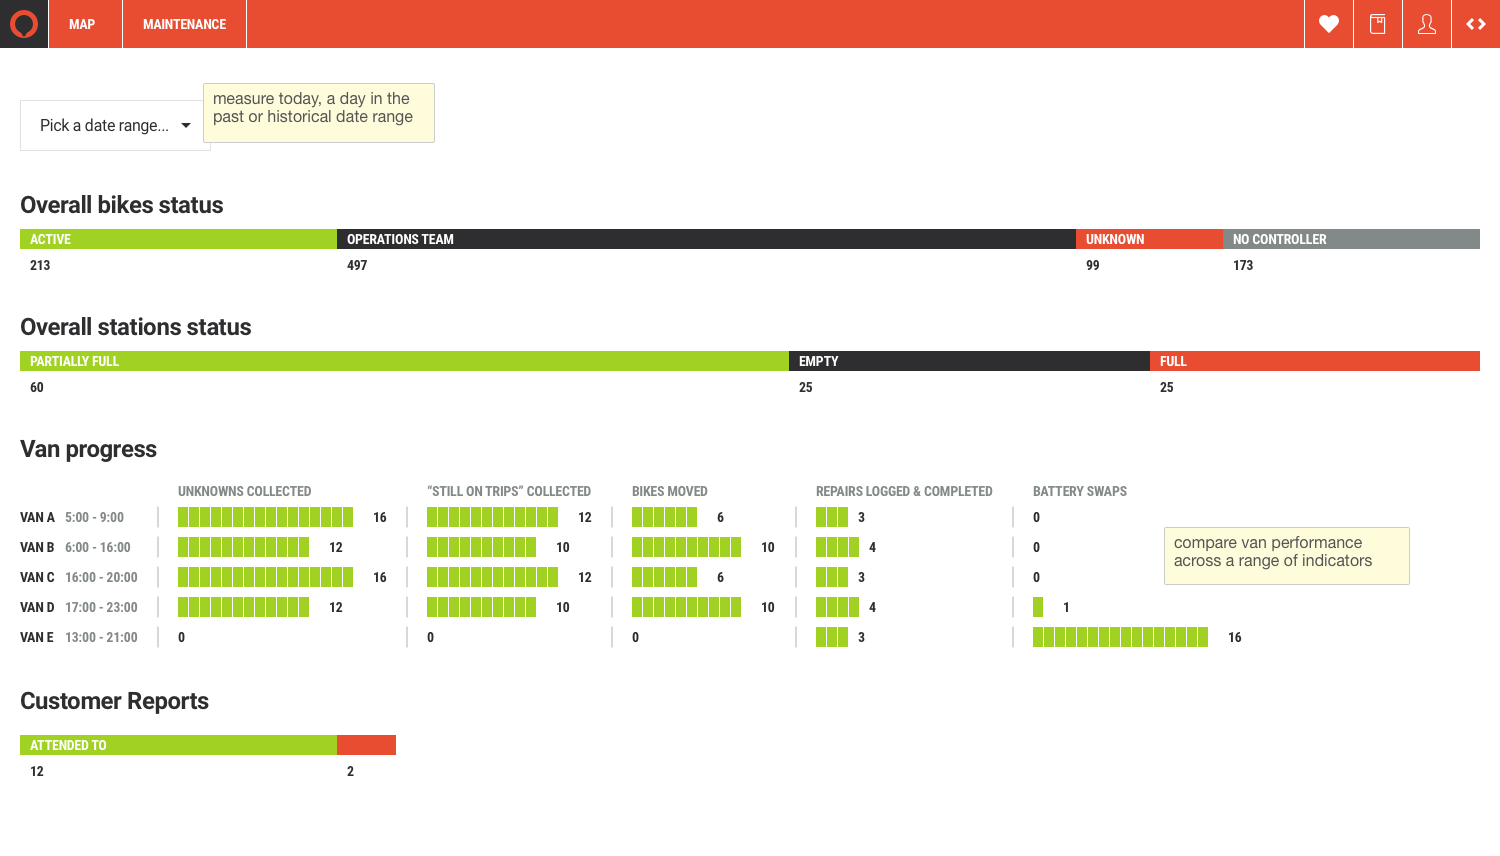
From an operational point of view, things like maintenance can be streamlined through route-planning for engineers and bike retrieval (for those that inevitably get dumped or mis-treated). Running an algorithm that takes into account time of day, traffic situations and the most suitable route for a driver to pick up bikes and return them to docking stations, or to grab bikes needing repairs is a good opportunity to cut down on wasted employee-hours.
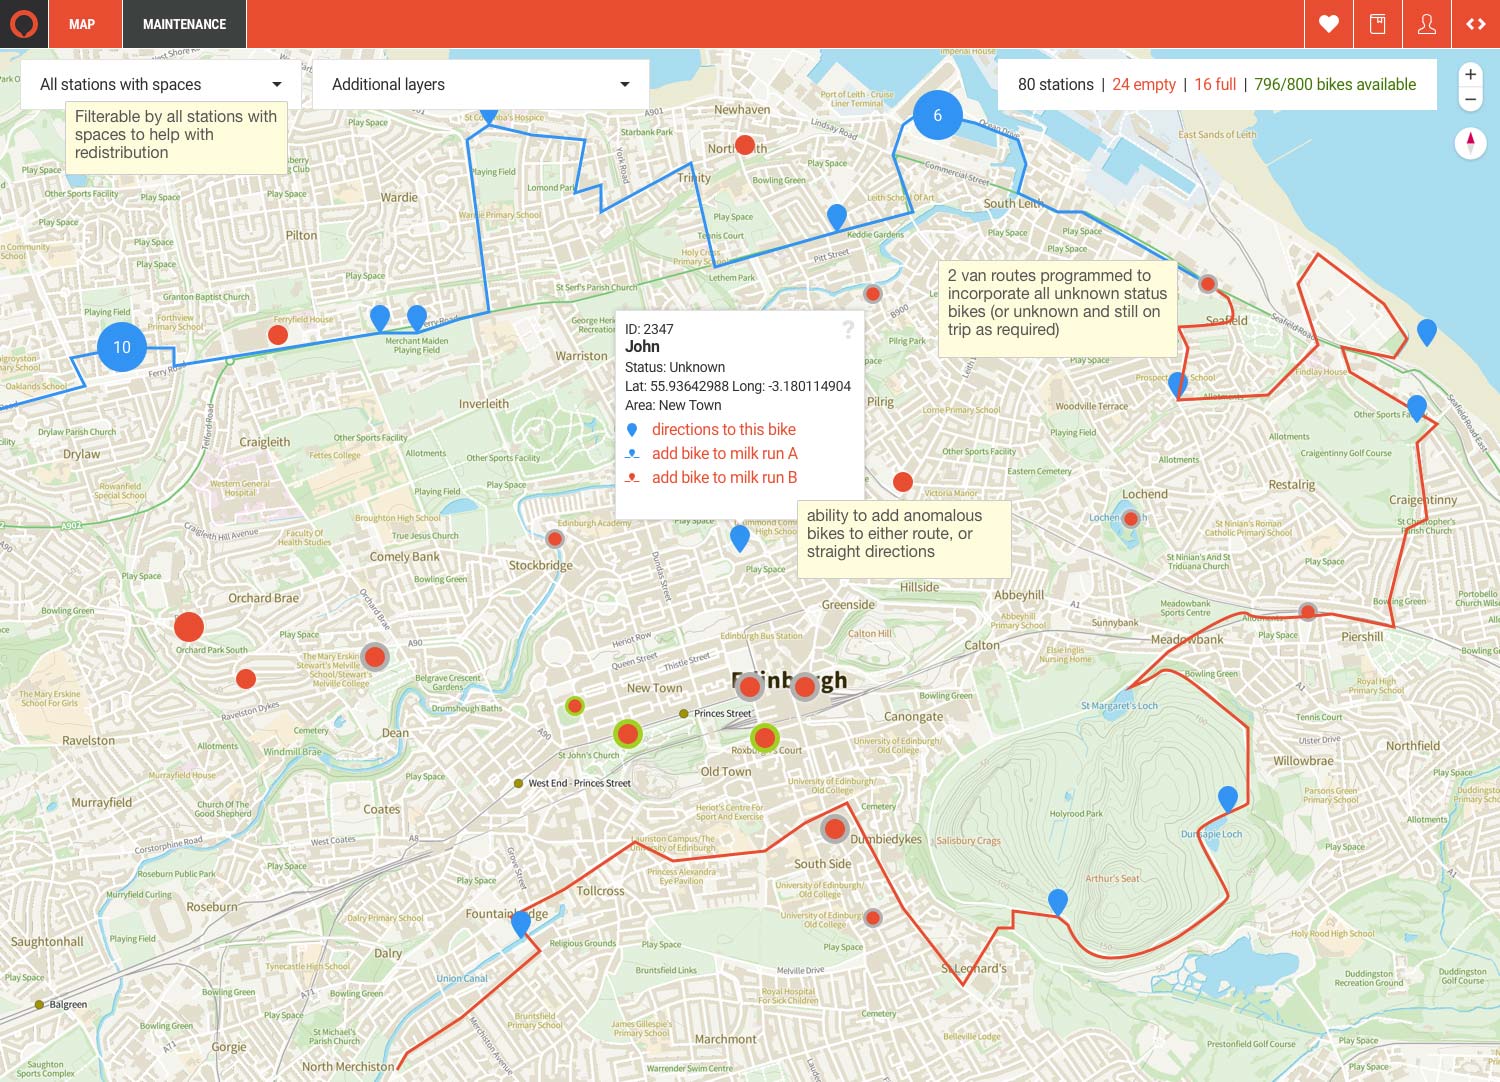
What about taking that a step further, and using a system that automatically sends the drivers their route each morning, giving them information on how big their van will need to be, how many new batteries or which tools they’ll need to take with them on that route? The more data you can augment the system with (from other sources) the more nuanced and effective a solution can be.
From a bike user perspective, it could mean the difference between knowing there’s going to be a bike available at your local docking station. It could be that certain docking stations offer a discount to incentivize spreading the bikes across different docks. It could be that collection of the discarded bikes is incentivized via discount or points collected.
There’s also the possibility to gamify the system to encourage usage. Let’s say a fitness app like Strava shares some of its data on commonly cycled sections, times and leaderboards for those who cycle them. Now you can take your route, and pit yourself against other cyclists who took the same route. Did you do it faster or more efficiently? How many lights did you need to stop at?
Let’s say you were able to plug in weather data to your bike scheme system. Now you can look at predicting usage volumes with historical data. How has the usage varied over the last year, when linked to weather? What about usage during events, or when a festival is ongoing. Edinburgh has a prime example with the International Festival and Fringe Festival running in August. Most likely a key period for the cities cycle hire scheme.
Management of such a system is also likely to be made easier with a system that can do some degree of prediction. From the previously mentioned messages to van drivers and engineers right through to prediction algorithms. How about performance logging for your staff? Tie that to staff incentives or rewards and you’re building a formidable management system run on the power of data.
A platform like Brainnwave’s thrives on taking this sort of data, augmenting it with our existing data providers, mapping it geographically, working in algorithms to prioritize opportunity and bringing it all together to provide a top-down management view, or a bottom-up user-accessible view. The power of the platform really lies in the ability to take data and use it to generate insight.
The potential to use data for good here is huge. We can really benefit the community while helping to build forward-thinking organizations. I really think the platform has the potential to sit at the forefront of this digital transformation.
Assuming the world begins to return to some semblance of normality over the next few months, I think the power of our platform could really come to fruition.
Whether it’s through something as straightforward as the confident and capable management of a cycling scheme to empower people to get out and about more after quarantine, or to bring new customers to businesses which need it, or whether it’s something far more complex.
The world is changing at an alarming rate and considering how much data we have at our fingertips, I think that not only is this a digital transformation for many businesses, it’s a complete turnaround on the way we all use data for good.